

One Tool, Two Data Sources
The sales team sees years of archived orders and today's live orders in one place. Each person sees what their role needs, from a single rep's own customers to the whole team's figures.
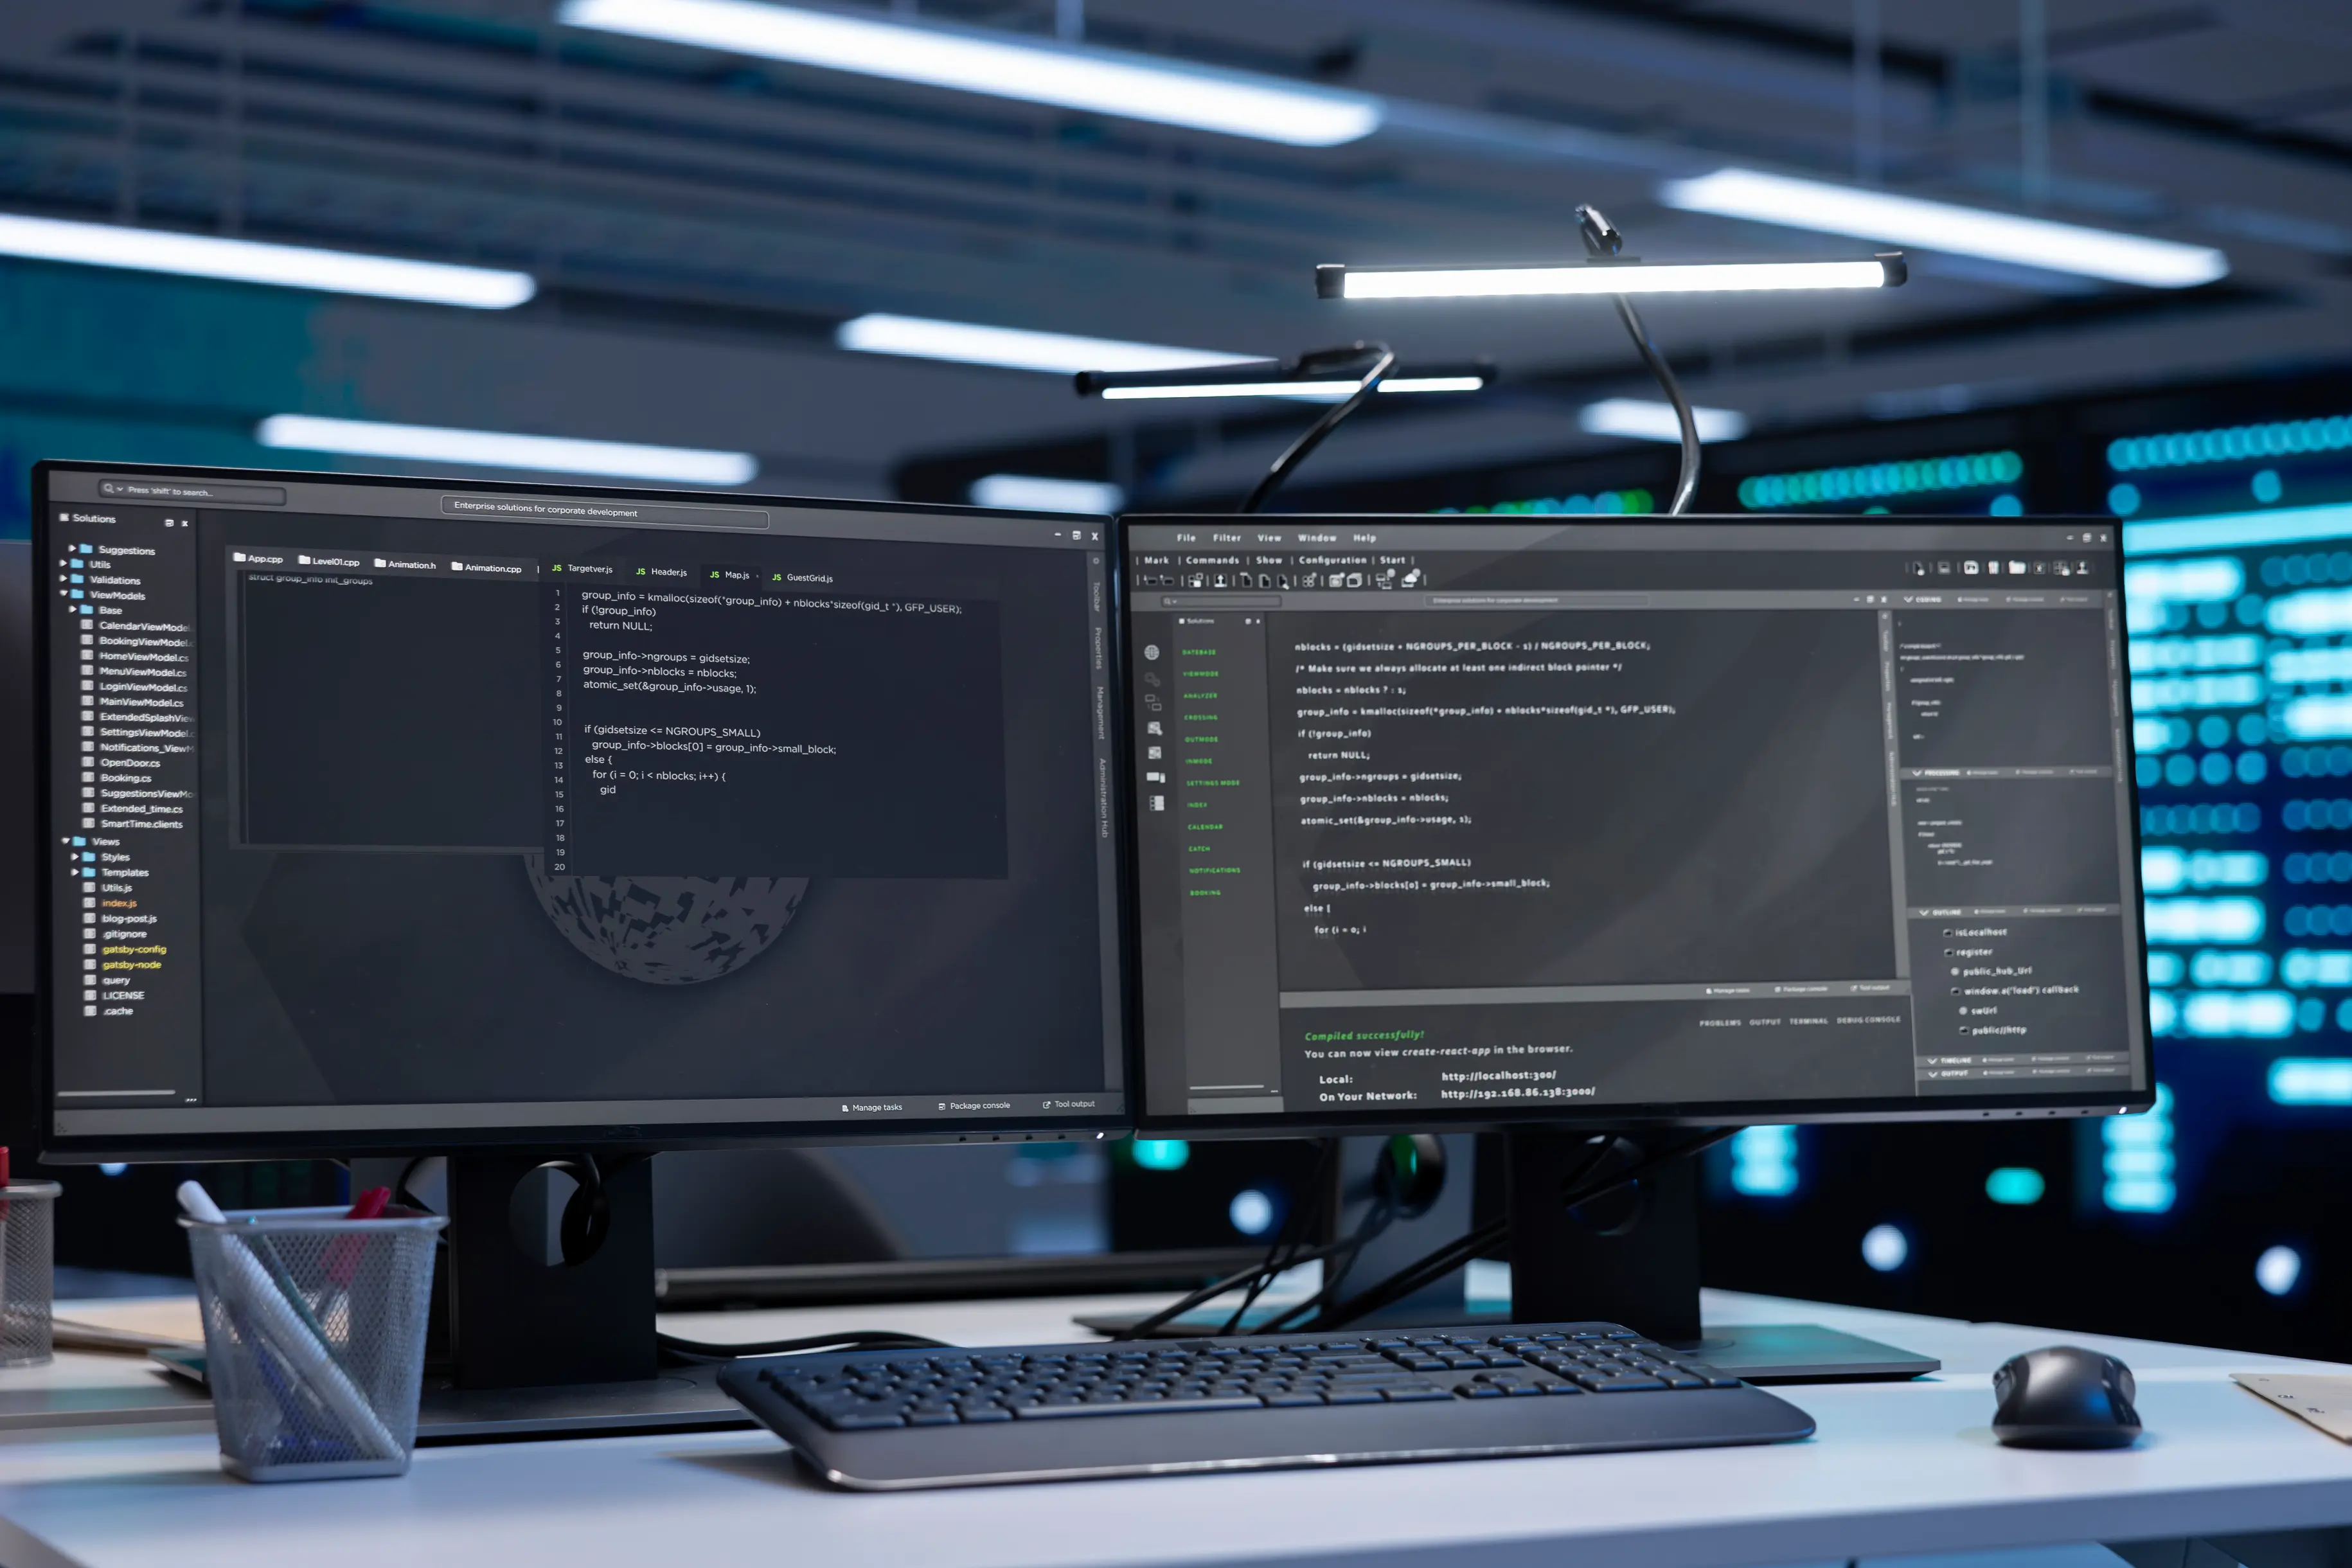
AI tools have moved past the hype phase. For smaller businesses, the question is no longer whether the technology is real, but where to start using it.

Most companies already have a website. Whether it brings in enquiries comes down to speed, the words customers search for, clear copy and simple design.
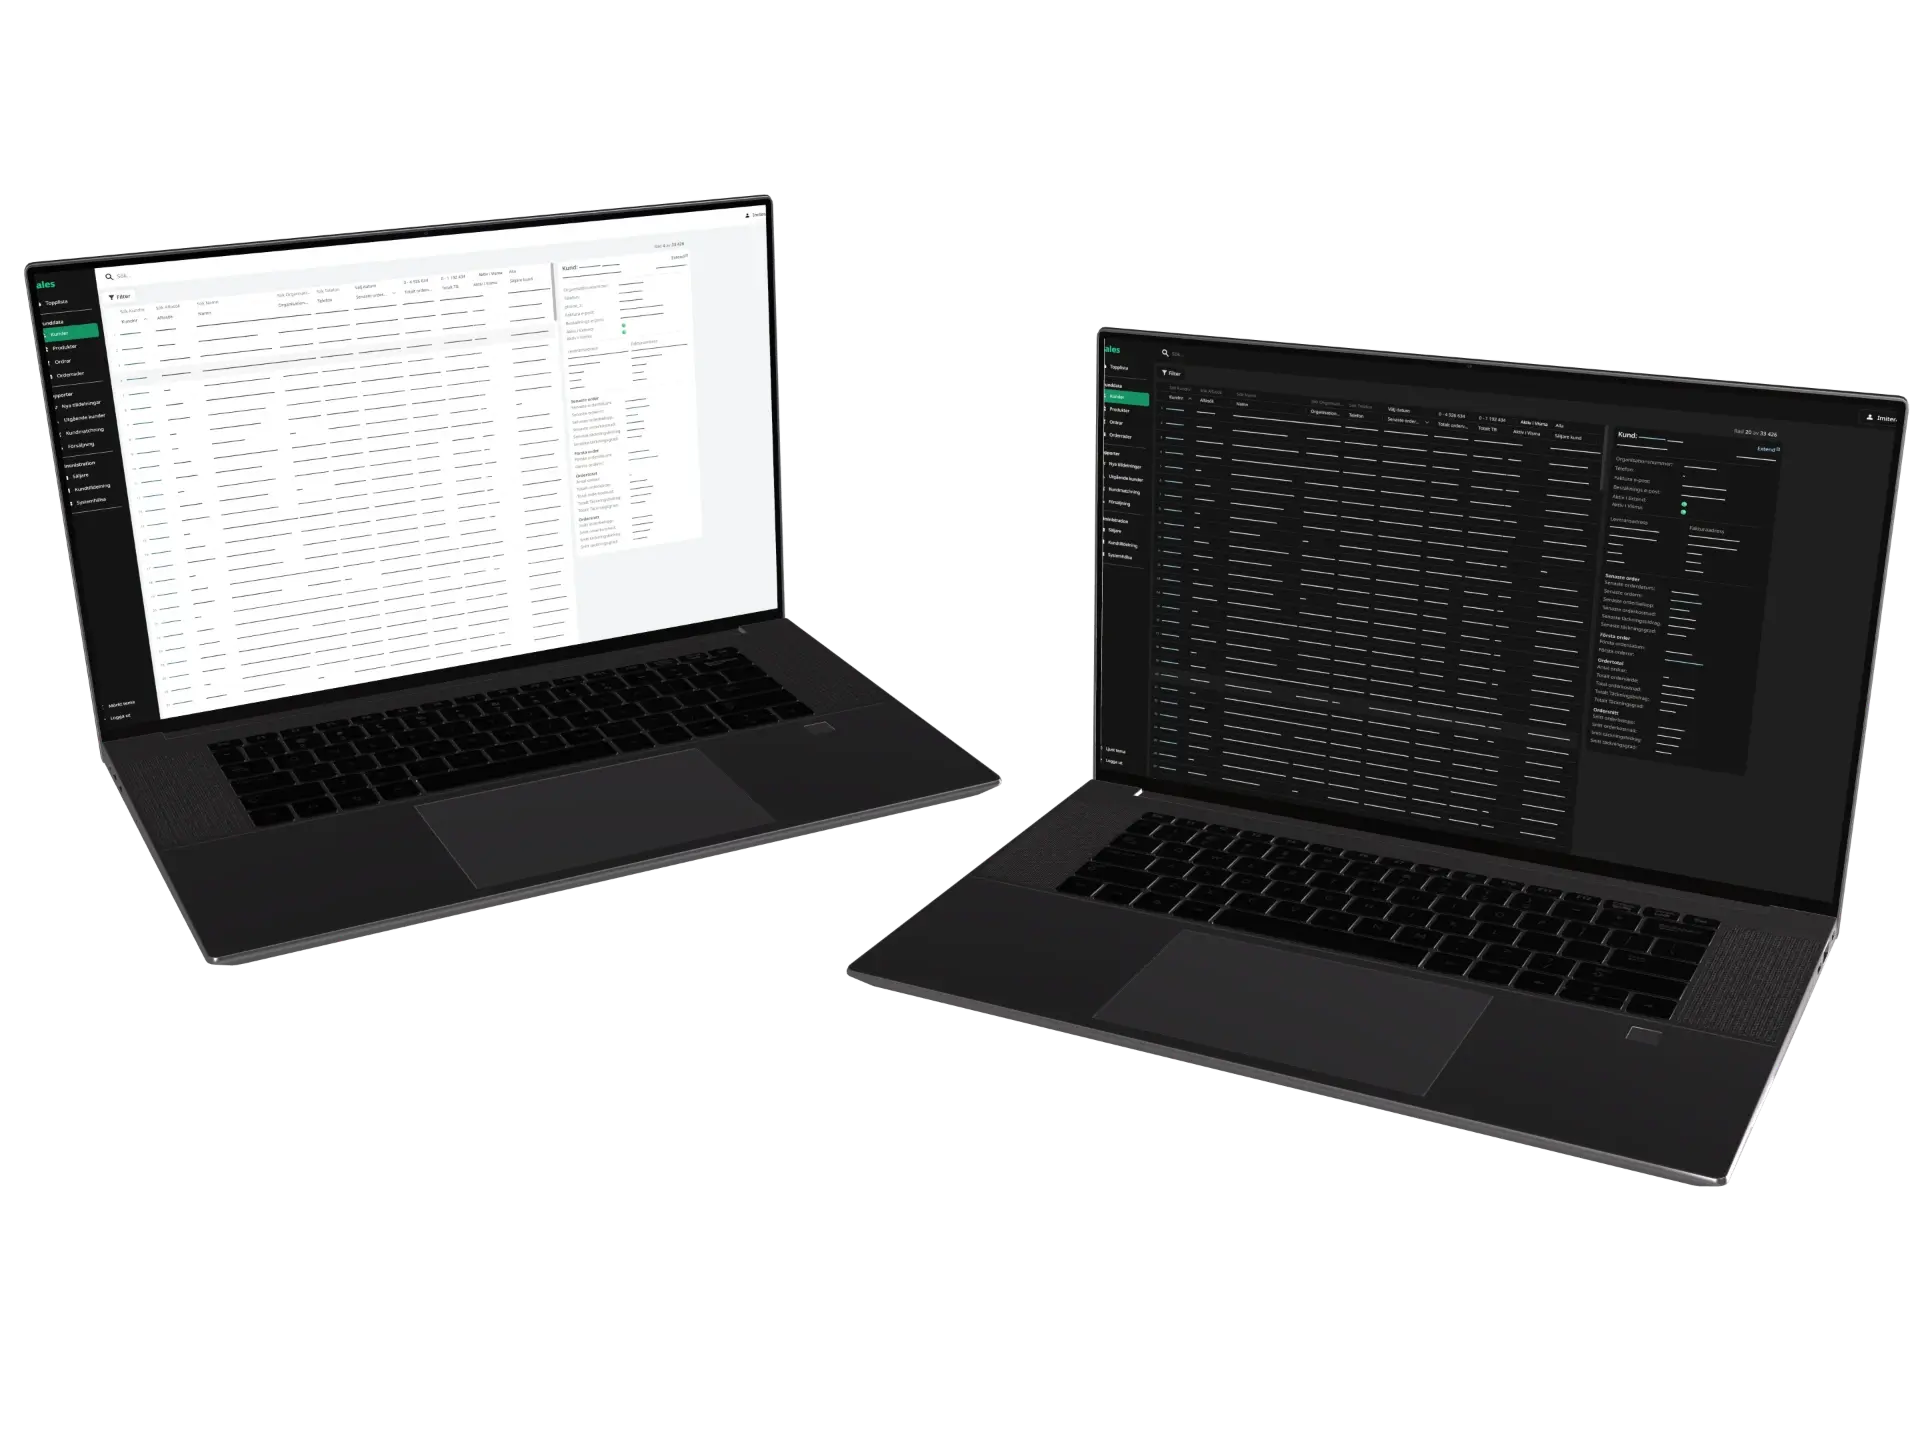
We built a sales tool for a team whose orders were spread over an old system, Extend Commerce and Fortnox. Reports, a leaderboard and customer records now show archived and live orders together, and each person sees what their role needs.
The tool has three parts. Each one answers something the sales team asks every day, such as how sales are going this month, who is ahead and what a customer has bought before.

Revenue, contribution margin and product sales per salesperson and for the whole team. The reports draw on both the archive and the live order system.

Each salesperson's revenue, number of orders and contribution margin, updated as orders come in. Managers see the whole team, and each rep sees their own figures and how they compare.

Customer records with order history, invoices, purchased products and notes. Salespeople manage their own customers, and administrators move customers between them by dragging.
Nothing was specified up front. The tool was built in three steps, each one started when the team needed it, so there was something useful to work with from the first step.

When the company changed systems, the data from the old one was kept and made readable in the tool, with access by role. The sales team had years of customer and order history from the first day, and nothing was lost in the move.

An integration then read orders, customers and products from Extend Commerce and invoices from Fortnox through their APIs, so the archive and today's data appear side by side.
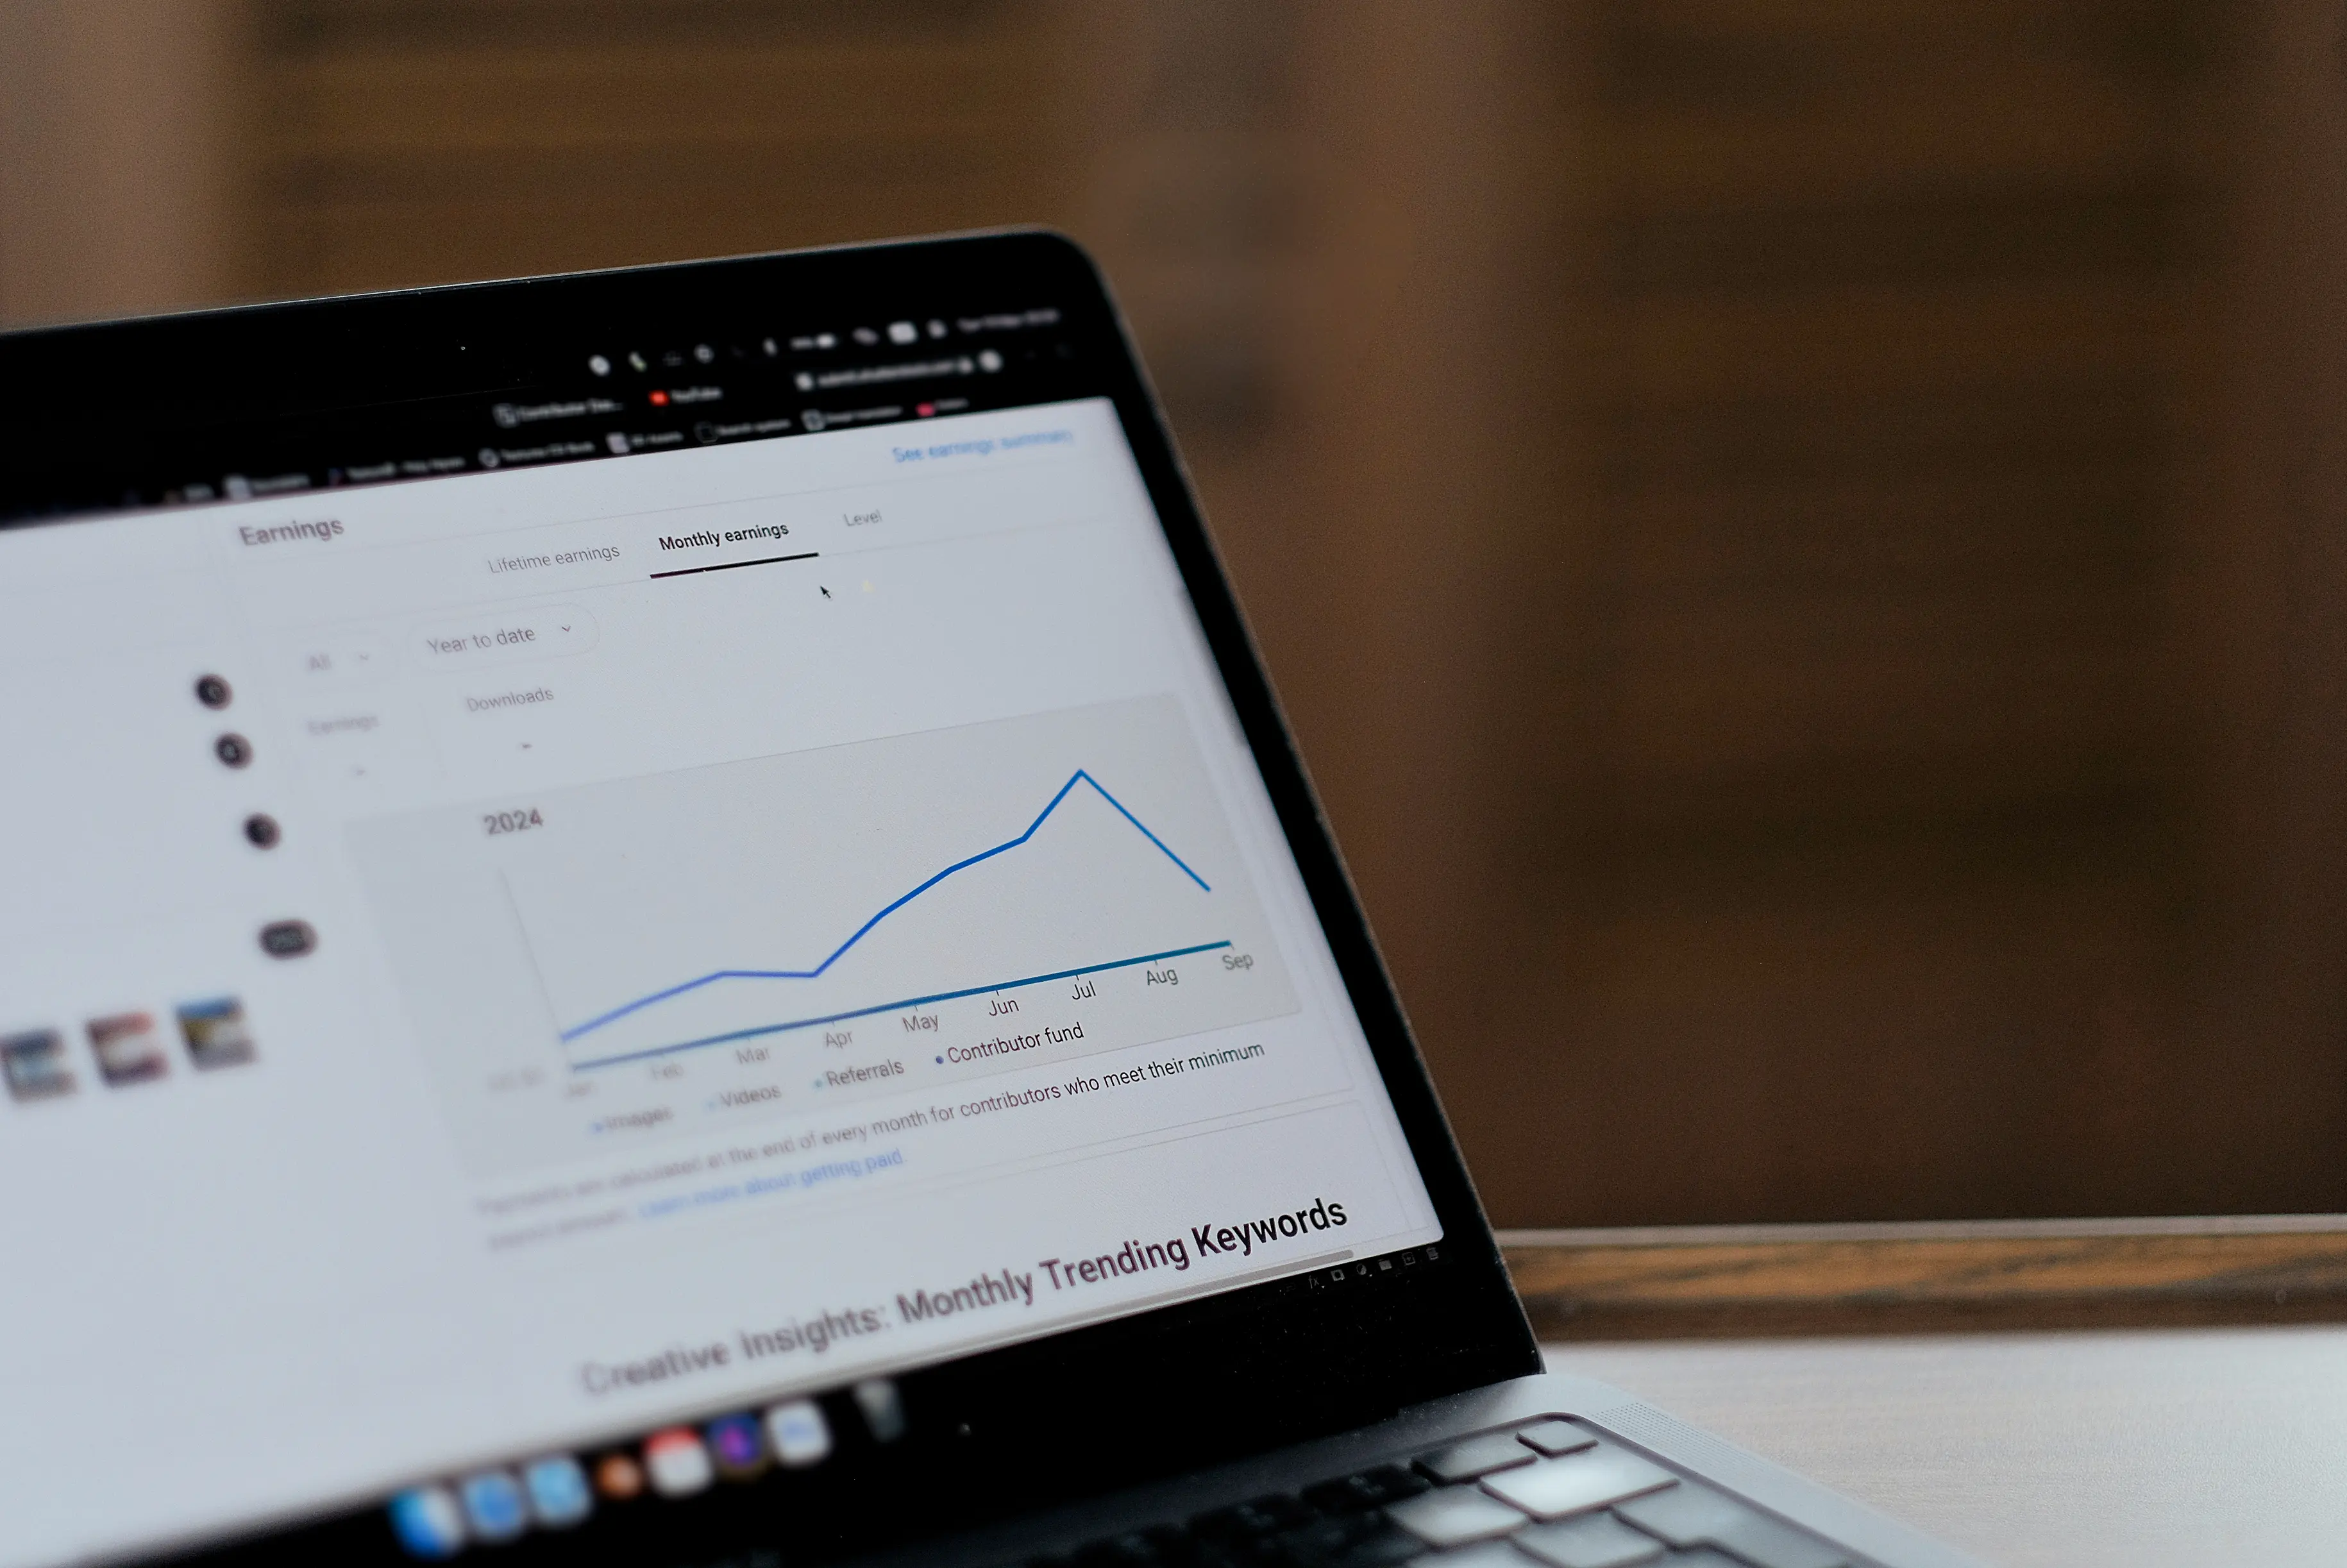
Sales reports, the leaderboard, product figures, customer assignment and monitoring followed, each one added when the team asked for it.
The tool keeps growing as the team's needs change. New parts are added to the same tool, so the team never has another program to learn or another login to remember.
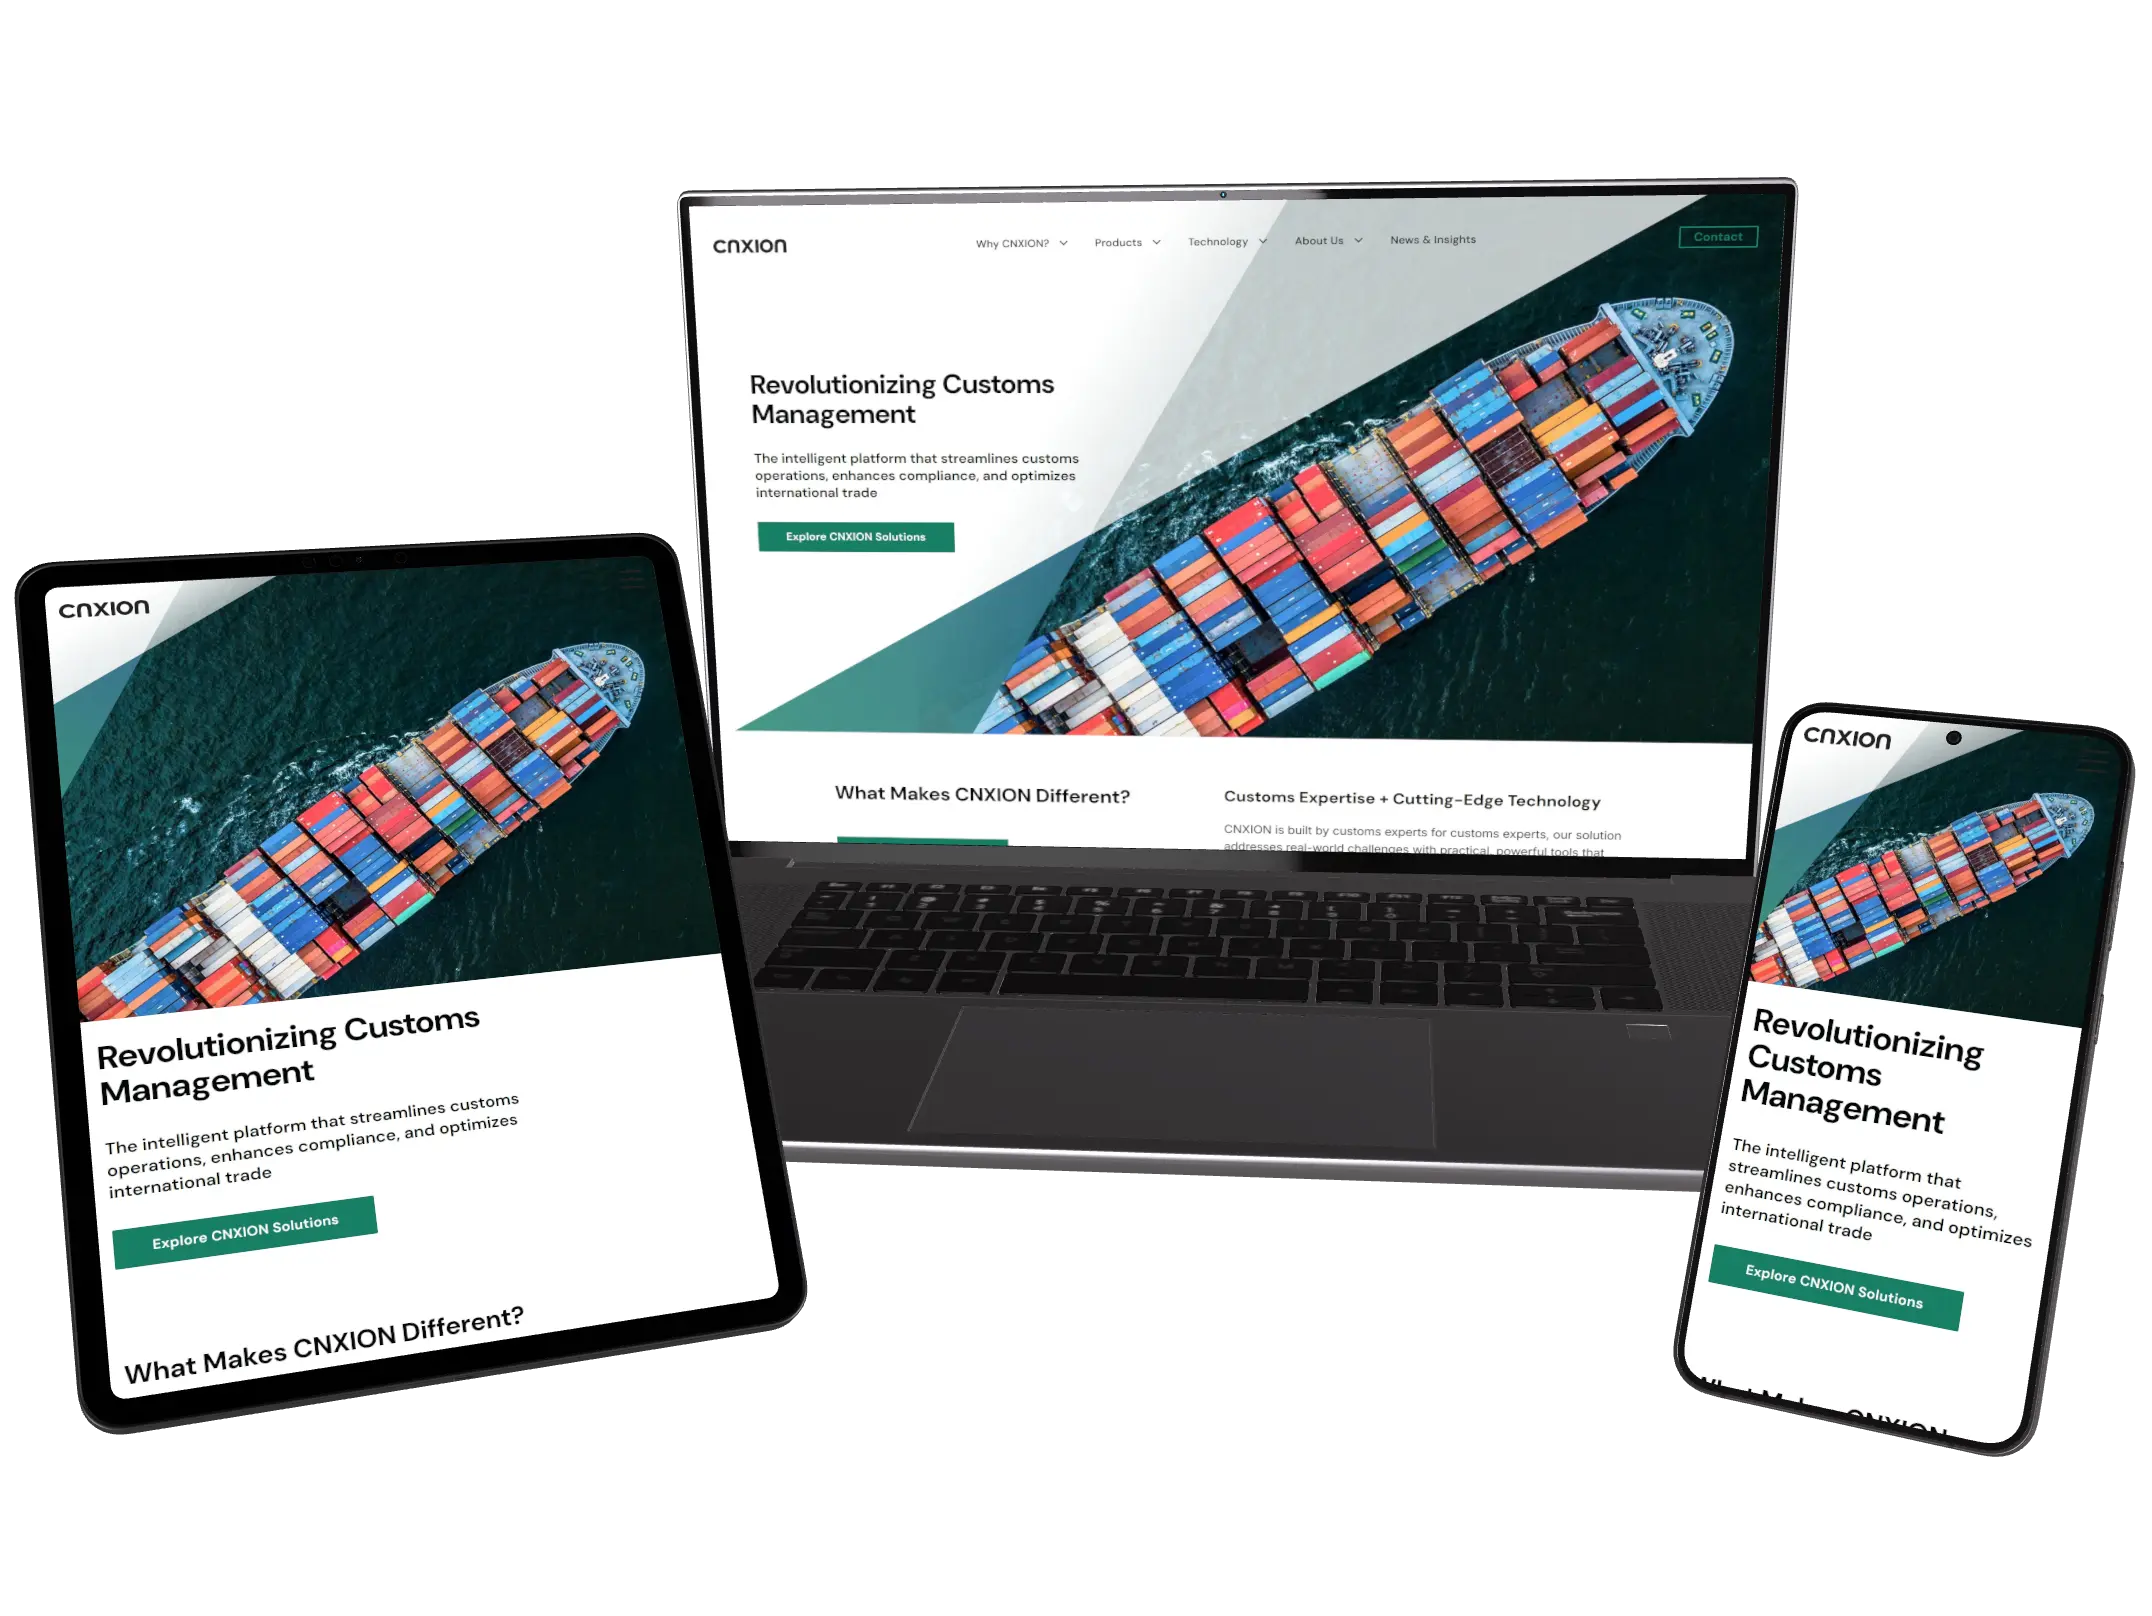
We designed and built the website for CNXION, a Swedish company that makes software for customs and logistics. The site explains what the product does to the people who use it, and how the technology works to the people who have to trust it.
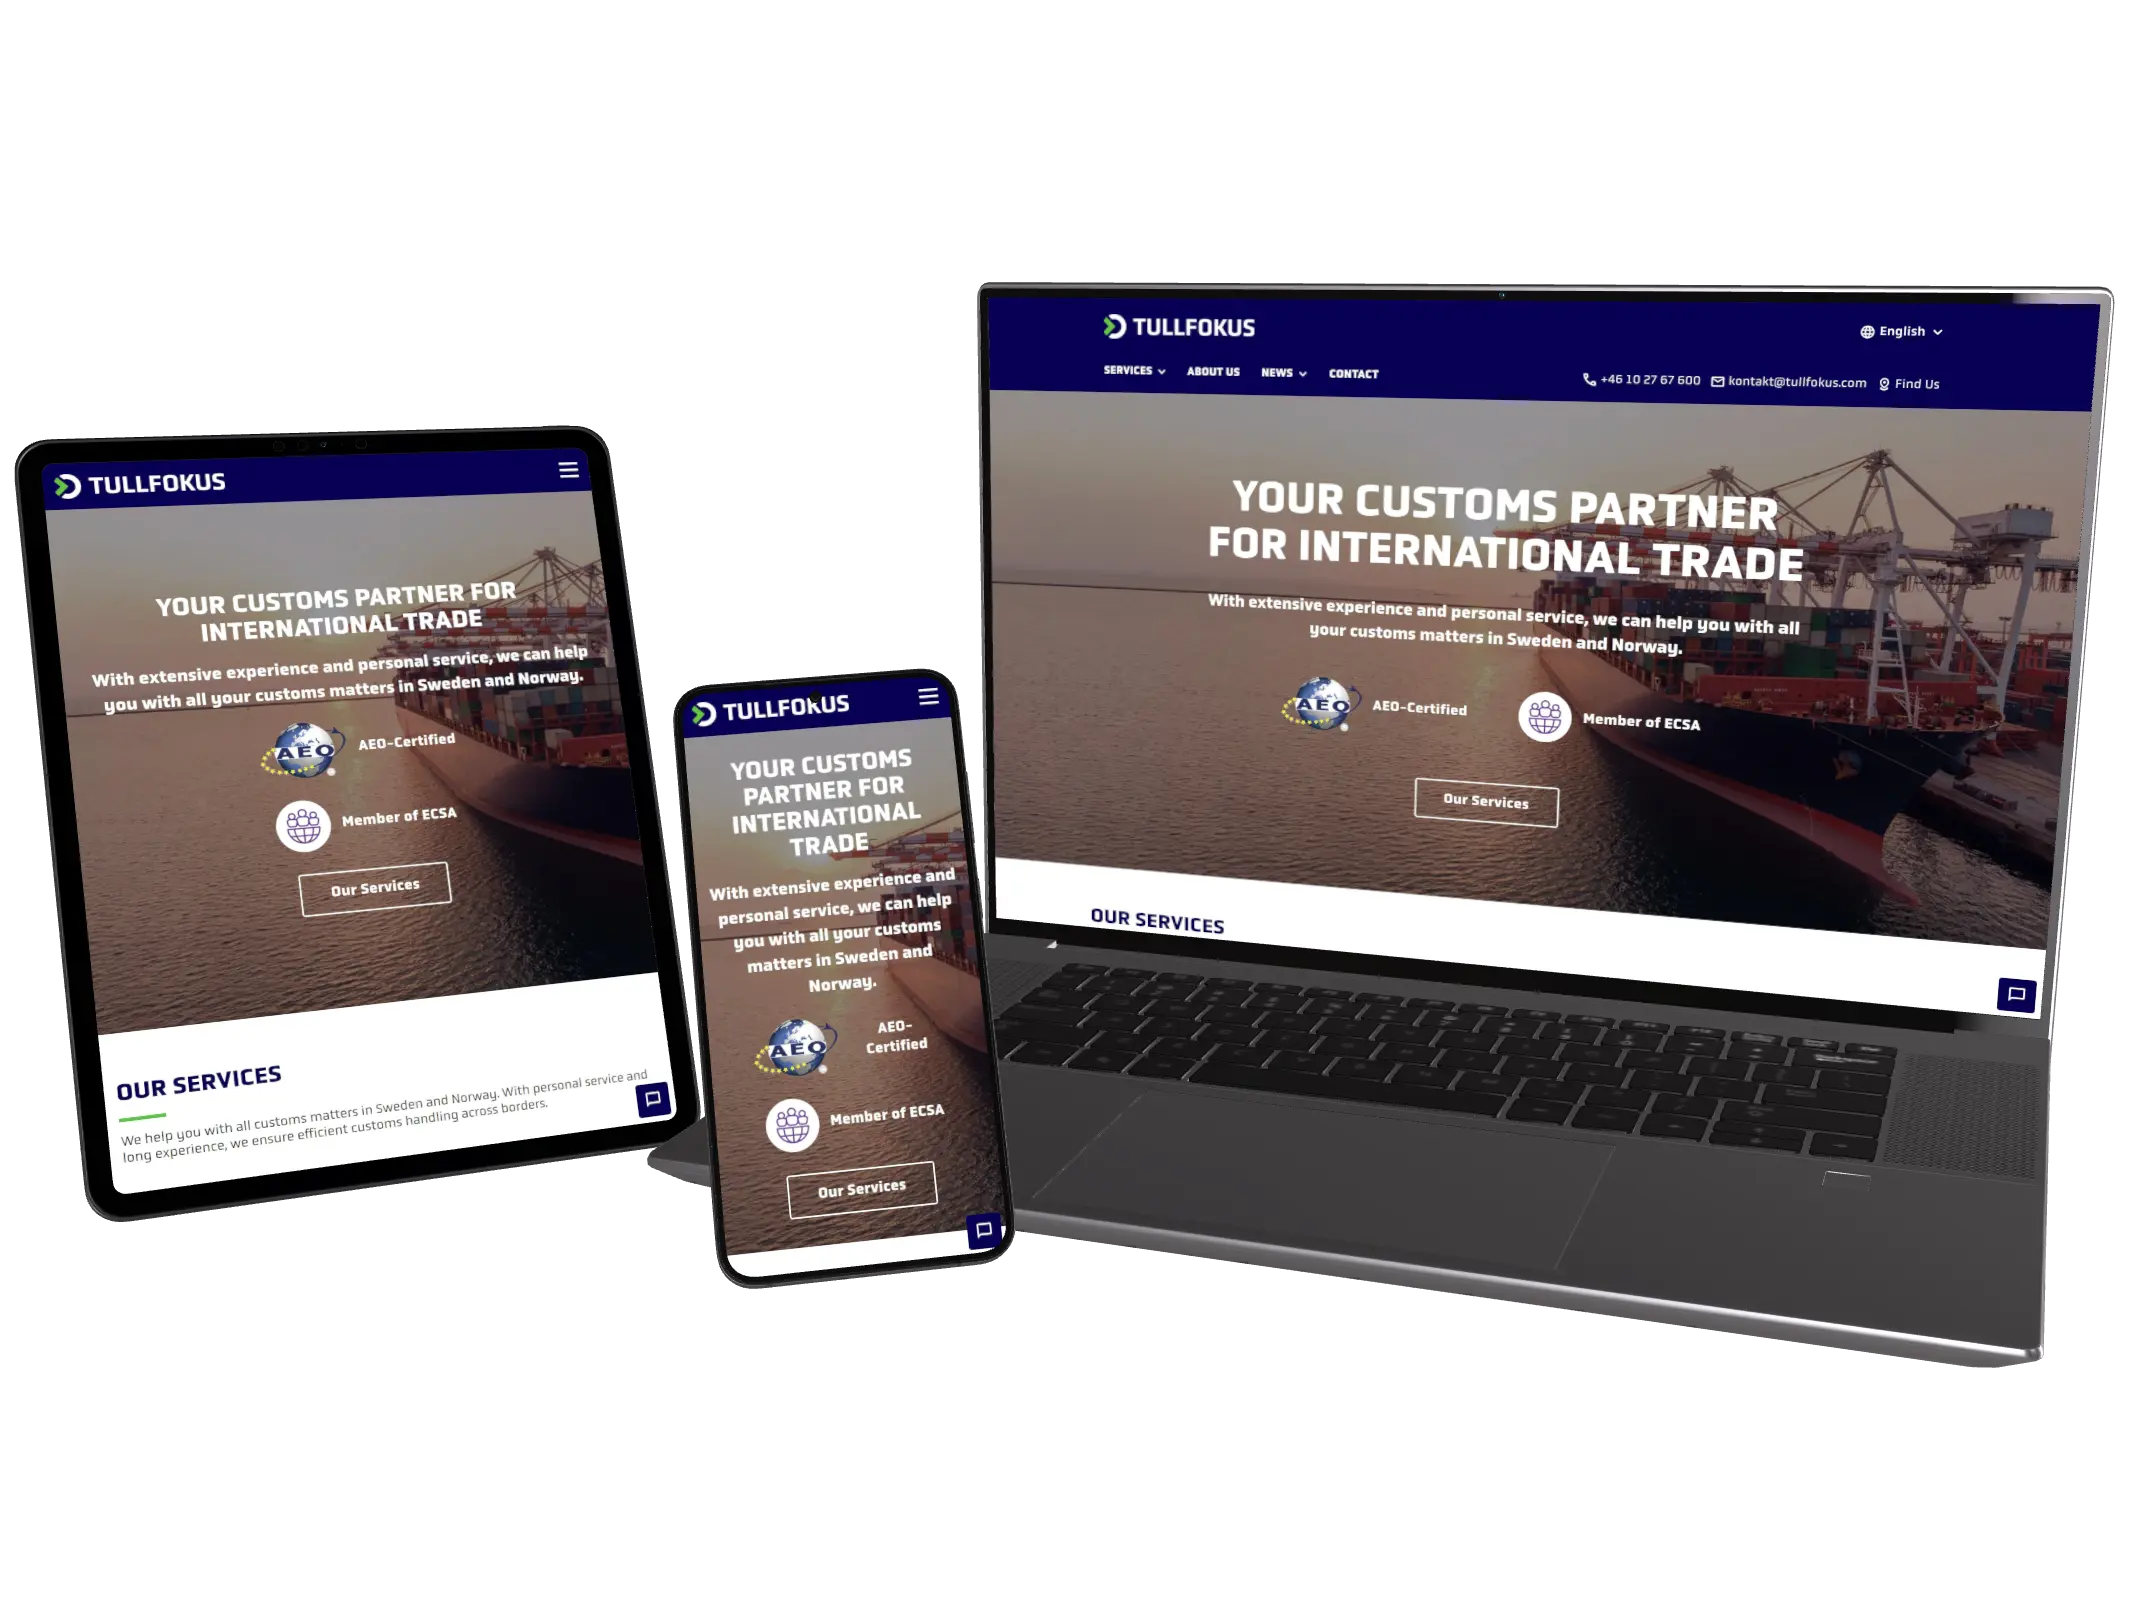
Tullfokus is a Swedish customs broker that handles import, export and transit declarations for companies. We replaced their old platform with a fast website in Swedish and English, where each service has its own page and the right contact is a click away.
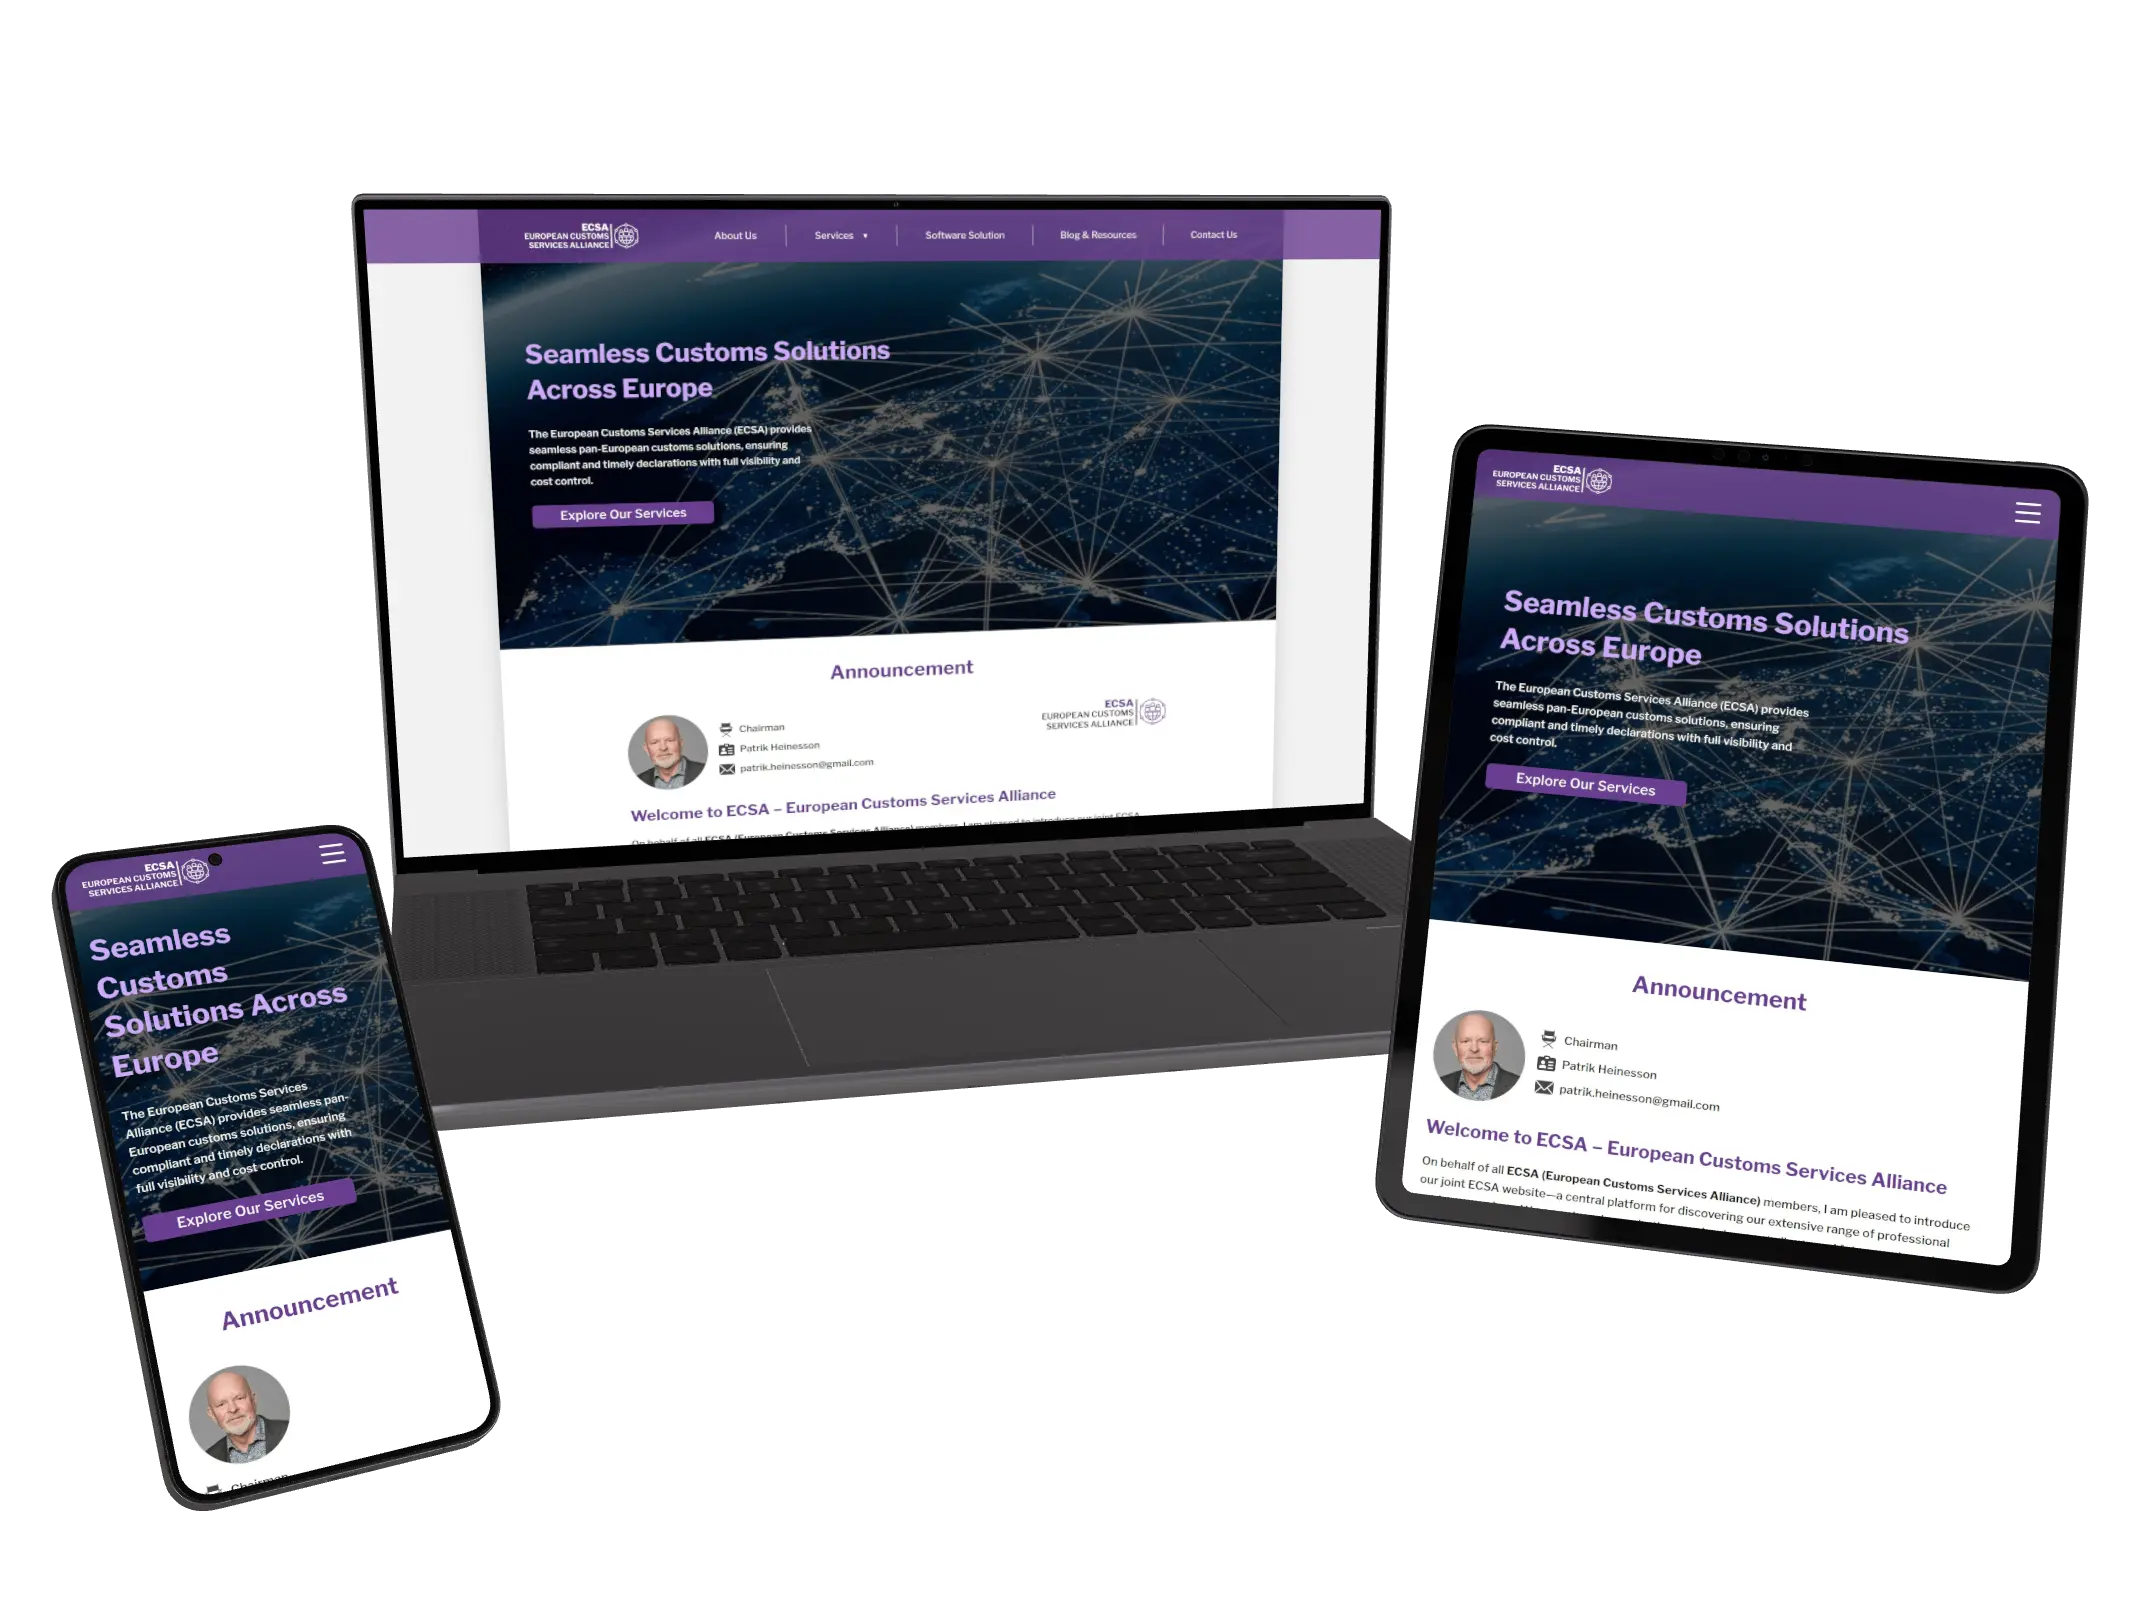
ECSA is a European network of customs service providers. Their designer drew the site, we built every page from those designs and wrote the content with them, and ECSA's own team now keeps the text up to date in our app.


